
One of the cool features of the Narrative Reporting suite is the ability to integrate already created reports from the Management Reporting tool into report packages within the Narrative Reporting tool. This allows customers to reuse already created report content.
However, the nuances of how this exactly works eludes some folks, so today’s post is about this integration.
First of all, what exactly gets “imported” from MR?
Management Reporting reports can have 5 types of objects on them: grids, charts, text, images, and notes. The 2 that can be imported into report packages today are grids and charts.
What this means is that the report in its entirety does not import into report packages – just pieces of it. And from my work with this integration, this is preferable. Report packages generally have their own headers and styling, so importing those elements from reports can create more headaches.
How is this Integration Set Up?
Reports content is viewed as another form of embedded content. So if you’re familiar with how to add Excel embedded content, then this is not a leap in expectations and understanding.
Let’s get started! First, you will need to create a reference doclet for each report that you want to borrow content from. You don’t have to create one for each object of the report that you wish to import, just one in general for each report.
Navigate to and open your report package. Select to create a new reference doclet:
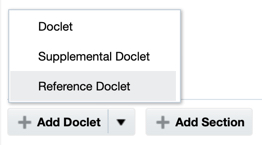
In the properties window, make sure to choose the Report type and not the Excel type:

Then for the “Doclet” field select the Management Reporting report (and choose to link to the source report if you want to keep that link live for updates later):


You’ll receive a prompt to select members for POV dimensions (regardless if applicable). Any POV dimensions where users are not locked down to a specific member list will appear here. If the dimensions are locked down, no dimensions will appear in this list so press “OK” to bypass. (We’ll come back to what this means and how you set that up later.)
When there are applicable POV dimensions, this screen allows you to select a member or variable for each. You can change this selection later when you refresh the underlying report content (which we’ll discuss in part II).
In this example, the Segments POV dimension in my underlying report is completely open to users to select whatever member they want. So I see that dimension in the list and can select the POV member that I want to serve as the basis of my imported report content. If there is a variable created for the Segments dimension, I could also select the variable instead.

If the POV is being controlled by an underlying variable and you want that variable value to auto-update, select the “Auto Update Variables” checkbox at the bottom.
Note: if you want to be able to select multiple members for imported content, then you’ll want to change the options in the underlying report’s POV dimension. We’ll talk about this later in this post.
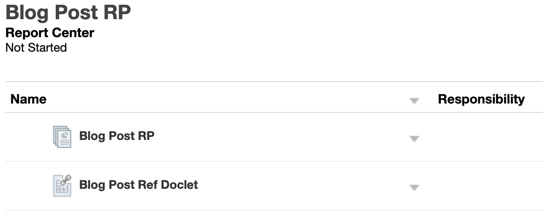
Save the reference doclet and add a viewer user, if required. You’ll see your new reference doclet in the Report Center:
Now let’s make the Management Reporting objects linked to that reference doclet available as embedded content. First, check out that new reference doclet:
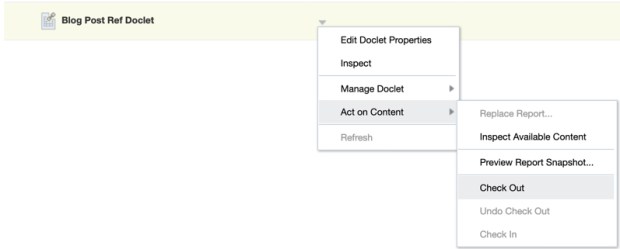
Next, add available content:

Press the + symbol to add new available content:

A list of available report objects for import will generate. Put a check next to the items you wish to add.
My recommendation here is to select only the report charts and grids you really will use, not all that are available. You can always add more embedded content later, and adding more than you need can impact the refresh time of the underlying report objects.
In this case, this Management Reporting report has only a single grid available for import. I put a check mark next to that. I can also override the name of that imported grid on the report package side to something more descriptive (more on recommended naming conventions in part II of this blog post):

You may not see the exact same generic setup or number or type of objects as shown above and that will depend on a couple of POV dimension settings in the underlying report.
Detour: Let’s talk about what that means.
The options that will determine what available content you see in your list is in the bottom half of the POV Dimension Actions in the underlying Management Reporting report. You’ll see this menu when you’re in the grid editor and you select the Actions menu next to the dimension POV:

“Display Suggestions Only” means that you want to hard-code the POV member selection list to only what you selected as the report developer. For instance, I want my users to select only quarters for a Time dimension, not months or YearTotal, so I make Time my POV dimension. For choice options, I only select quarters and then I go into the dimension POV Actions menu and select Display Suggestions Only. When a user goes to run the report, they’ll be able to change their Time dimension member for the POV, but only be able to select quarters.
Second, is whether or not you have the option to “Print All Selections” turned on. Note that you can only turn this option on if you’ve already selected “Display Suggestions Only”. Print All Selections for a user means that all available members will print on separate pages when they run the report in PDF mode. From an “import-into-report-package” perspective, what this means is that separate grids will be available, 1 per member.
This is a bit hard to describe, so let’s see an example.
When you don’t have both options selected in the underlying report, back in the report package reference doclet:
- You will see at least one dimension in the POV window that appears once you select a report to attach to the reference doclet
- And when you go to add available content you see only a single grid, just like in the report and report package used in my example instructions:
Note that you will see the same when you have Display Suggestions Only selected but not Print All Selections selected.
When you have both Display Suggestions Only and Print All Selections selected for a POV dimension, you won’t see that dimension in the POV window that appears once you select a report to attach to the reference doclet. However, when you go to add available content, you will see a grid option for every member you selected for that POV dimension member list:

OK, detour over. Going back, my single grid content has been added:

Once I check back in this doclet, the report grid now becomes available to Authors during the Author phase to embed into their doclets. Within Word or PPT, they will use the same Embed icon within the Smart View Narrative Reporting extension that they use for Excel embedded content.
As I started writing this, I realized that the post was becoming too long. Yikes! Therefore, I’ll leave the rest for part II. In the next part of this post we’ll discuss how the underlying report content gets refreshed, tips for naming conventions, and the nuances of embedding Management Reporting charts in report packages. Stay tuned!

One thought on “Narrative Reporting Series: MR Import into NR Part I”