
Back in April I posted a part I of this blog post, which covered the basics of importing MR report content into report packages. Here are the remaining concepts for that post.
How does this MR content get refreshed?
Earlier this year, I learned the hard lesson that this content is not auto-refreshed. Steps have to be taken to refresh the chart/grid if the data changes or the structure of the underlying report object changes. Luckily, this can be completed through only a few mouse clicks.
To refresh the structure and data, you have two options:
1. At the report package level, refresh the entire report package and all supporting MR objects. You can do this through each report package by using the Actions menu. You can choose to refresh all report objects using a specific data source, or refresh all data sources (and thereby all report objects):

Note: there is a performance limitation with this type of refresh. If you have a number of report data sources and embedded objects (it’s hard to say what the limit is exactly), and the objects don’t seem to be refreshing, opt for Option #2 below instead.
2. Refresh each report reference doclet individually. This is more manual, but will cost you only a little bit of extra time if you don’t have many to refresh. This option is especially useful if you have only one report reference doclet to refresh.
You can do this within the report package, by report reference doclet by using the action menu next to each report reference doclet and selecting the Refresh menu. Same options as global – refresh all data sources in the report reference doclet or just a single one:
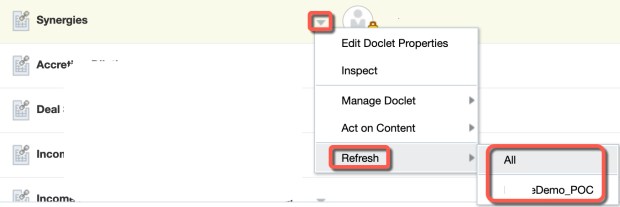
Note1: it’s important to understand the difference between an MR report and an NR report reference doclet. You may have multiple report reference doclets that point to the same MR report, depending on how you have configured the report POVs, etc. Therefore, when you do this second type of refresh, it’s by the report reference doclet, not by MR report. So if you have 3 report reference doclets that all point to the same MR report, you have to manually refresh all 3 doclets.
Note2: the two refresh options listed above are server side refreshes. This means that the heavy lifting is being done in the background on the server side. There is a way to do this on the client side through Smart View, but I do not recommend it in general, as it may temporarily reduce the ability to use your computer while the refresh is executing.
I messed up and I need to replace the report being referenced. Do I need to start over by creating a new report reference doclet?
No! Luckily, Oracle already thought of this and created a cheat option. In the action menu for each report reference doclet, there is an option to replace the report being referenced. Navigate to the report reference doclet’s action menu, then Act on Content, then Replace Report…:
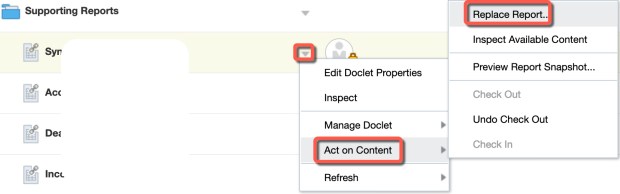
Considerations: if your replacement MR grid/chart is named differently than the original report and the prior report objects have already been embedded into your doclets, then you might have to delete that embedded content before bringing in the replacement report. Instead of these extra steps, a better option is to remap that old embedded content to the new embedded content. You can perform a remap through the report reference doclet action menu, then Inspect | Available Content.
The Importance of Naming Conventions
Due to the potentially high number of development objects used in reporting, it’s critical to design out naming conventions in advance. Here is a list of commonly used development objects for report packages:
- Report package
- Source report
- Source report objects (2 different types available for import)
- Doclets (3 different types)
- Embedded content (2 different types)
- Excel named ranges
- Variables
The number of objects can grow out of control and then you lose sight of what’s pointing to what. I highly recommend that you come up with a naming convention with the following attributes:
- Reference doclets – prefixed with the source type (Report or Excel)
- Variables – prefixed with the type of variable value (Text, Data, Date, etc.)
- MR report embedded content: grids prefixed with something like “Grid_”
- MR report embedded content: charts prefixed with something like “Chart_”
- Excel embedded content: grids, charts, etc. – prefixed with “Excel_” and should match the source named range
- Excel named ranges – prefixed with the type of object (Text, Grid, Chart, Image, etc.)
Formatting Embedded Report Content
I always tell customers that formatting will take the longest amount of time when working with either report packages or reports.
Think about it. When you use report embedded content, you are starting with a formatted chart or grid that had its own boundaries and properties back in the source report. Now you’re trying to take that object and fit it into the bounds of a report package, which has new boundaries in Word, PPT, or PDF. So there will be some tweaking required as you go from one set of margins to another. I recently did a webcast that covers a whole bunch of reporting tips and tricks and you can gather some formatting tips from there.
Nuances with Charts
At customer sites I’ve been asked to embed both charts and grids from reports into report packages. There are some nuances when working with charts:
- A small portion of every embedded chart seems to be cut off. Without more testing, Im not sure if this is always the case or if it depends on the version of Word being used. Keep this in mind when you think about the layout – where the legend is positioned, how much text is used to label each x-axis item, etc.
- Use the best layout possible for the report package. Unfortunately, this might mean that you need to create a copy of the original report and reformat it specifically for use within a report package.
- The size of the chart box in the source report directly impacts what you see in the embedded content in the report package. It also impacts what you see in the resultant report. Again, you may have to create a copy of the original report and resize the chart in order to optimize it for the report package.
The integration of existing report objects into report packages can save you a lot of development time. Why not reuse what you have? Once you become familiar with the foundational concepts, you will become a master at this!
