
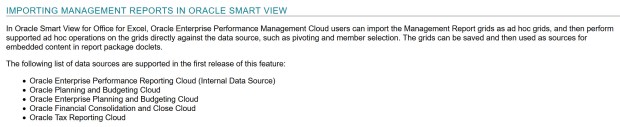
In Feb 2019, Oracle released the ability to import MR grids into Smart View. Yay for MR-Smart View integration! Here are the Feb 2019 monthly release notes on this feature:
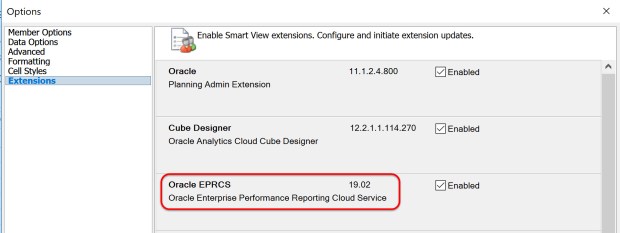
Intrigued by this revelation, I decided to get more hands-on with it. First, it’s important to update to the latest version of the EPRCS Smart View extension, as this activity primarily takes place within Smart View:
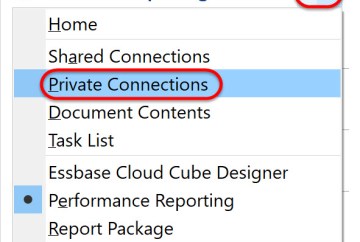
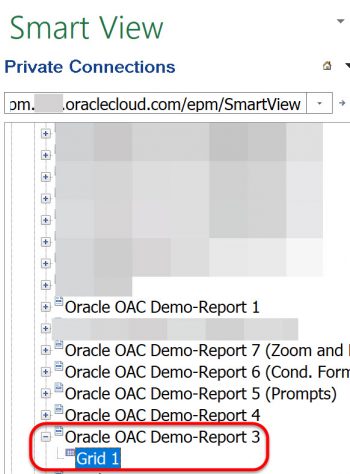
Next, connect to your EPRCS private connection. It will default to the Performance Reporting area once you successfully connect. Navigate back to Private Connections:
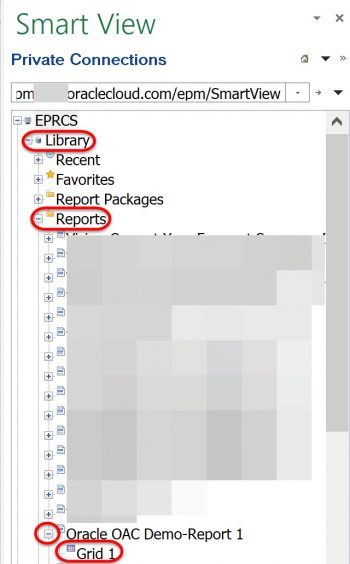
Then, navigate down the EPRCS Library tree to any folder with MR reports in it. I found a working demo MR report to start with:
If you click on the report name or the grid name, additional features will appear at the bottom of the Smart View pane. For instance, if you click on the grid name, it will give you quick information about which dimensions are located where, in addition to Properties, and the new option to import the grid as an ad hoc query:

Note that if you click on the report name, you’ll receive the Properties option which will give you basic information about that MR report:

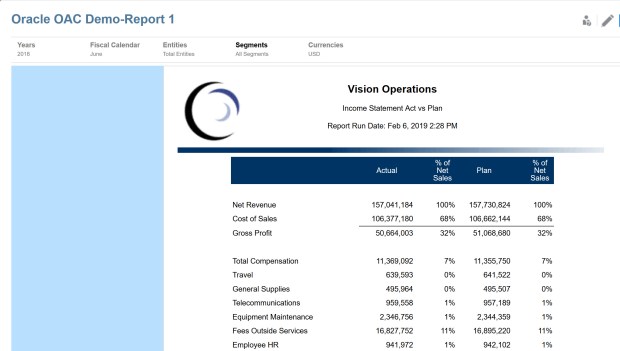
Before I show you what this grid looks like, here is the HTML version of the entire report:
Once I select to import the grid as an ad hoc query, this is what I receive in Smart View (after maximizing all column widths):
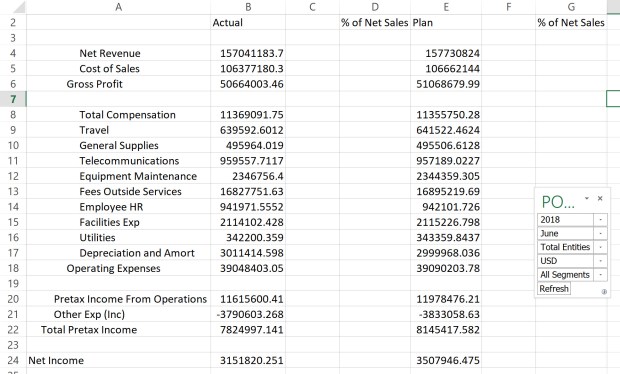
You might immediately notice that some data is missing. Why is that?
Remember that this is set to do an import as an ad hoc query. That means that only the ad hoc data is retrievable. If you look at the design view of Grid1, you’ll notice that the columns of missing data are actually formula columns written directly into the MR report:

Therefore, that data is not available in the source application (which in this case is OAC Essbase) so it’s not available for ad hoc queries.
Given this revelation, my mind wandered to other types of scenarios. What does a multi-data object MR report show? In this case I have a grid and a chart that’s based on the same grid:

Within the Smart View pane, I see only a single grid. Makes sense:
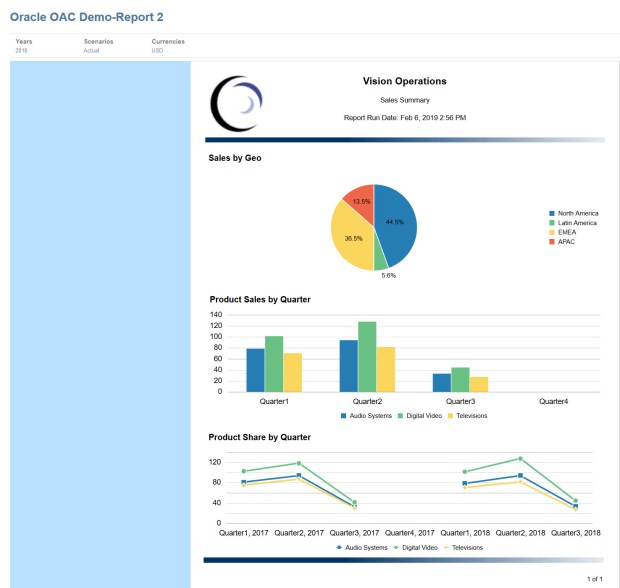
What happens when there are truly multiple grids in a single MR report, like the following? In this report, there are 3 charts and each is based on a separate grid:
This results in 3 distinct grids to download within Smart View from the EPRCS library:

So what have we learned in the initial release of this feature?
- Although not listed as a supported data source, OAC (Oracle Analytics Cloud) grid imports seem to work fine
- Any MR chart/grid can be imported into Smart View as an ad hoc query
- Importable grids will be listed in the EPRCS library Smart View connection by report and by grid
- Only MR data columns and rows will come over (hence the “ad hoc” import)
- The original MR report formatting does not come over
In addition, you can learn more about this feature via the Oracle online documentation: https://docs.oracle.com/en/cloud/saas/enterprise-performance-management-common/svuuc/eprcs_mgmt_rpt_import_102x01a7e483.html
What are the potential use cases for this new feature? Here are a couple that I can think of right now:
- Users can convert MR grids into Smart View ad hoc queries and use them in pure ad hoc mode, extending their investment with pre-built MR reports
- Users can import the MR grid ad hoc query for import into a Narrative Reporting report package via the embedded content feature. Instead of using the MR report formatting with a direct MR report import into NR (a different option), control the formatting in Excel through embedded content.
