
I’ve known a few customers who have put a crazy amount of conditions into either the conditional formatting or conditional suppression features of Reports. No judgment. If there’s a way to reduce the number of Reports you have to build and maintain by using conditions (while keeping the user experience positive) then I’m all for it.
One of the areas where I see Reports developers struggle, however, is when then conditions get complicated and “grouping” sections of logic is required. For instance, let’s say you want to show Products in your Report that are green or blue and have sales more than $1M. In abstract coding syntax, this type of statement might look like something like this:
(Product = green OR Product = blue)
AND
Sales > 1000000
The parenthesis group the 2 first conditions together. Ok, cool. But is there a way to do this in Reports?
There IS a way to do this. Many Reports developers I meet either aren’t aware of it or don’t understand how to use it. So here’s your handy dandy how-to guide on grouping condition statements in Reports! 🙂
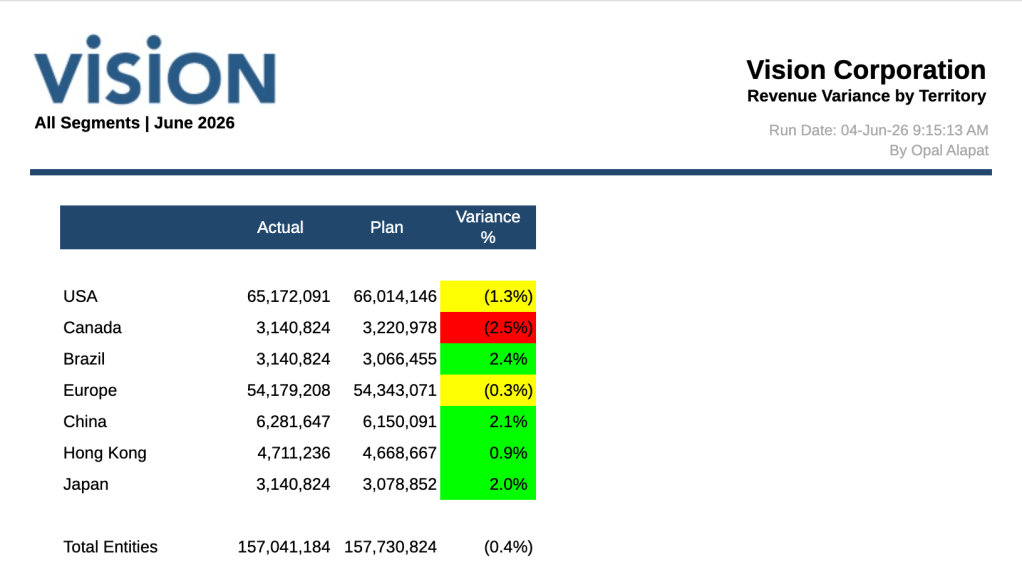
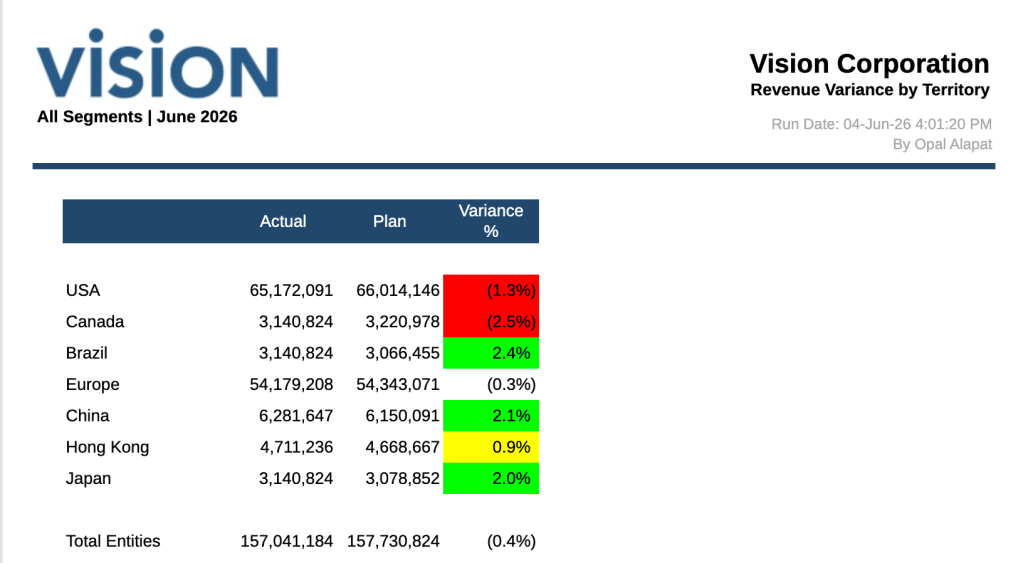
Here’s the example I will use throughout this blog post. This is Oracle’s Sample Report 6. It’s the one that demonstrates the conditional features. In this report, traffic lighting is being used on the Variance % column to indicate when the Revenue Variance % between Actual and Plan is within certain ranges.
Here’s how the “Red” conditional formatting is set up in the Report by default:
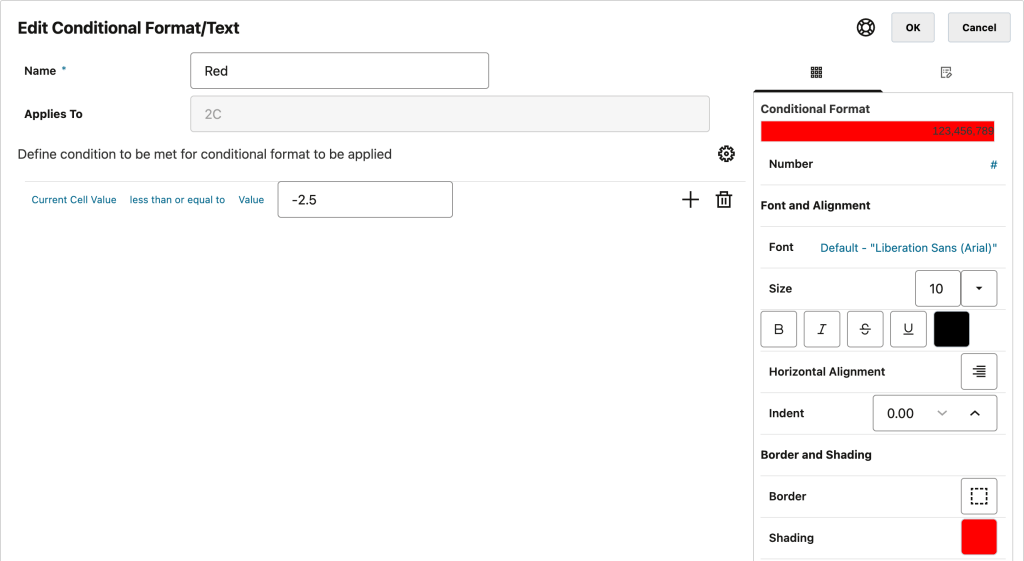
This logic translates to: when the values in the Variance % column are less than or equal to -2.5%, the impacted cells shade red.
However, something you should note first if you’ve never used conditional formatting in Reports… The conditions do stack and, if my memory is correct, the order of precedence is from top to bottom, with ultimate priority given to AND operators and groupings. So, if you have one condition that overrides another in your list, whichever one is nearest to the top wins…unless it’s used as part of an AND or a grouping.
I’m going to update my scenario and condition logic to set up what I need for this blog post.
Let’s say the Revenue threshold at my fictitious company has changed and now we need to alert with red shading to any negative value. However, we only want to watch the North American Entities (those prefixed with “E01”).
Let’s start drafting that. In my first iteration, the Red logic now looks like this (and the 4 hard-coded entities you see below are the North American members):
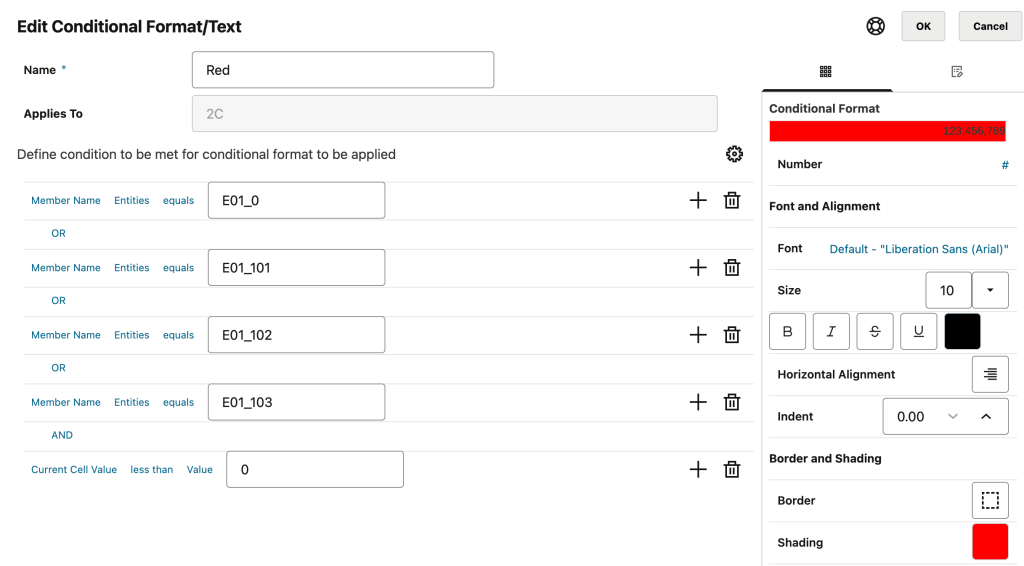
Note: I’ve turned off the Yellow and Green conditional formatting for this Report because they have conditions that conflict with the logic above. I also turned off all conditional suppression. When you’re playing around with conditional logic, it’s best to isolate your testing so you don’t get confused by any other Reports features that might override it.
When I run my Report with all of these changes, I get this result:
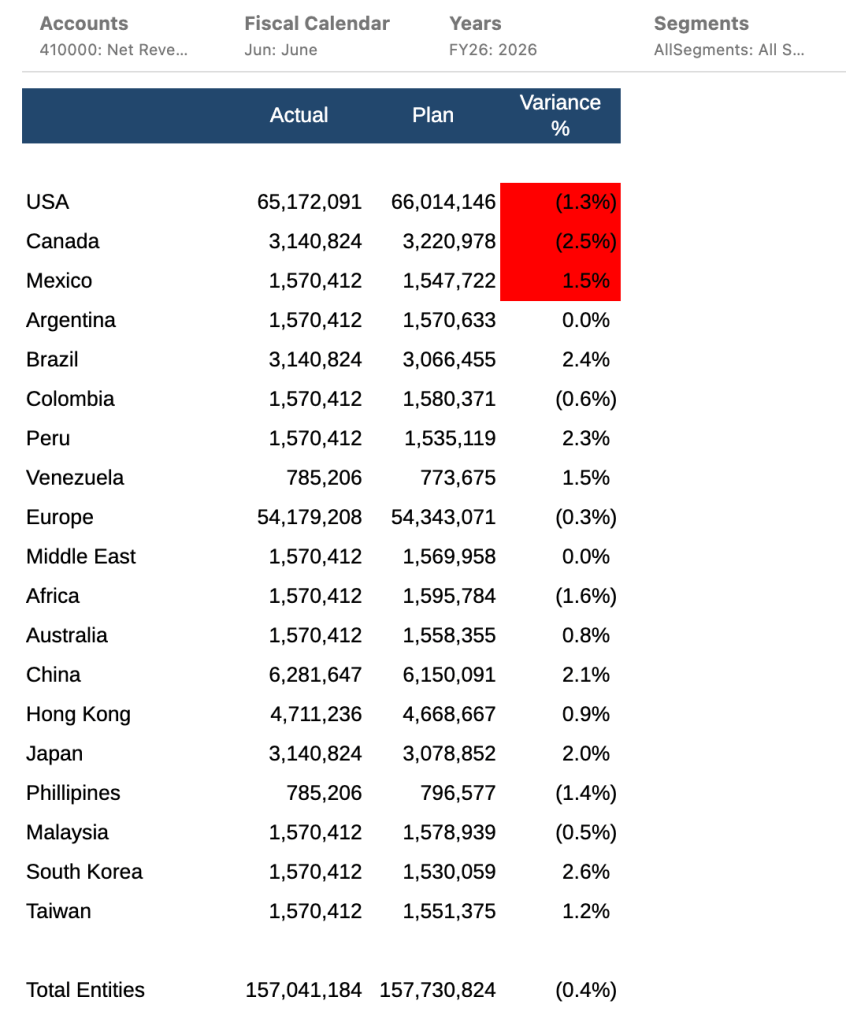
Wait, it’s working…right?
Not so fast. If you look carefully above, you can see that Mexico is shaded red, although its value is positive.
Aside: so what is the above conditional formatting logic doing since it’s not correct? To the best of my knowledge, I believe it’s reading the conditions as: if the entity is Mexico and has a negative value, then shade red. Also, shade all other North American entities as red. However, not gonna lie. It was a challenge to figure it out. If you change the order of the conditions, you’ll get different results. I’ll have to ask Oracle about this later…
So. to fix this, I need to group all the Entity conditions together. It doesn’t matter where the value condition resides, as long as it’s outside of the Entity grouping and uses an AND operator. I’ll change the order around so you can see that it doesn’t matter.
This is where things get a little tricky when grouping expressions, so don’t feel bad if you weren’t able to grasp this concept before. It’s not intuitive.
There is a special COG action menu where you can do things like move up/down your conditions, group/ungroup them, and duplicate/remove specific conditions. However, in order to use these options, you need to first highlight the entire block of logic that applies. And you will have to do it line by line. The Shift key doesn’t work here.
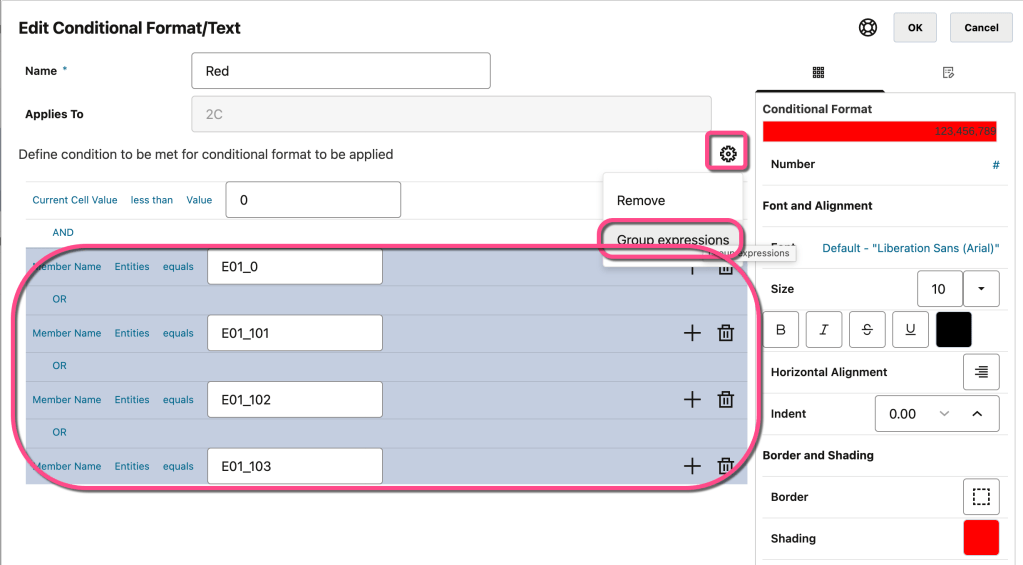
Using the Ctrl or CMD key depending on if you’re PC or Mac, first highlight all the conditions as well as the operators you’d like to group together. Then use the COG action menu to select Group expressions:
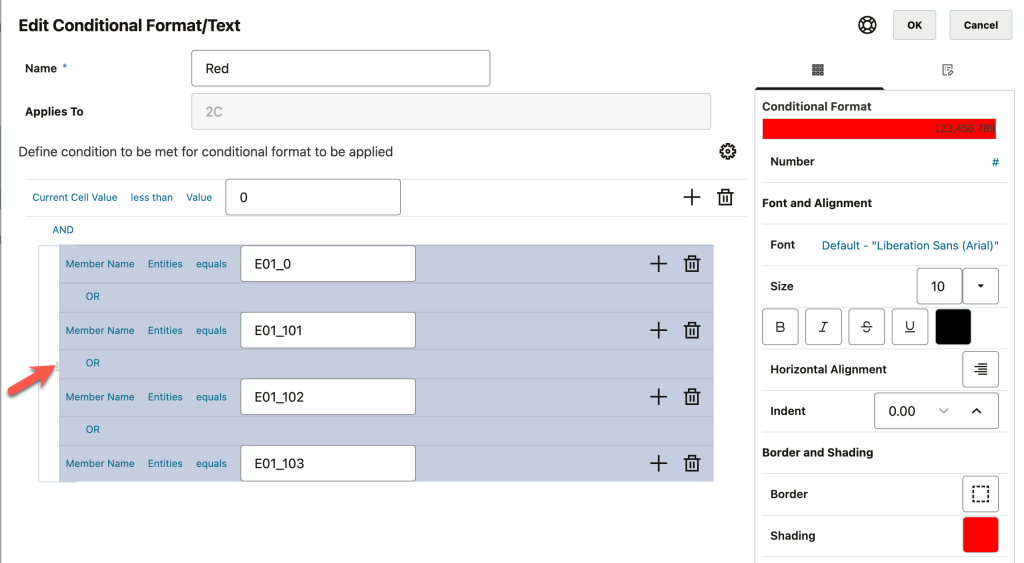
Once I add in the grouping, those conditions indent just a little bit to indicate they are together:
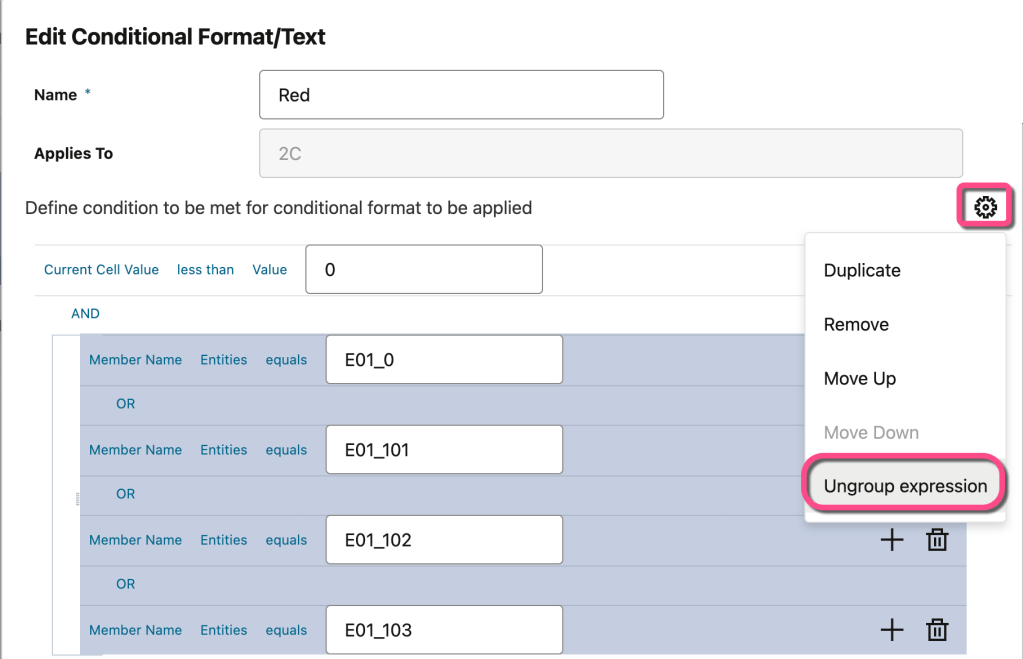
Note: I’m not going to do this, but in case you wanted to know how…to ungroup your conditions, simply highlight everything indented together again and use the action menu to Ungroup expression:
Now when I run the report, I get this result:
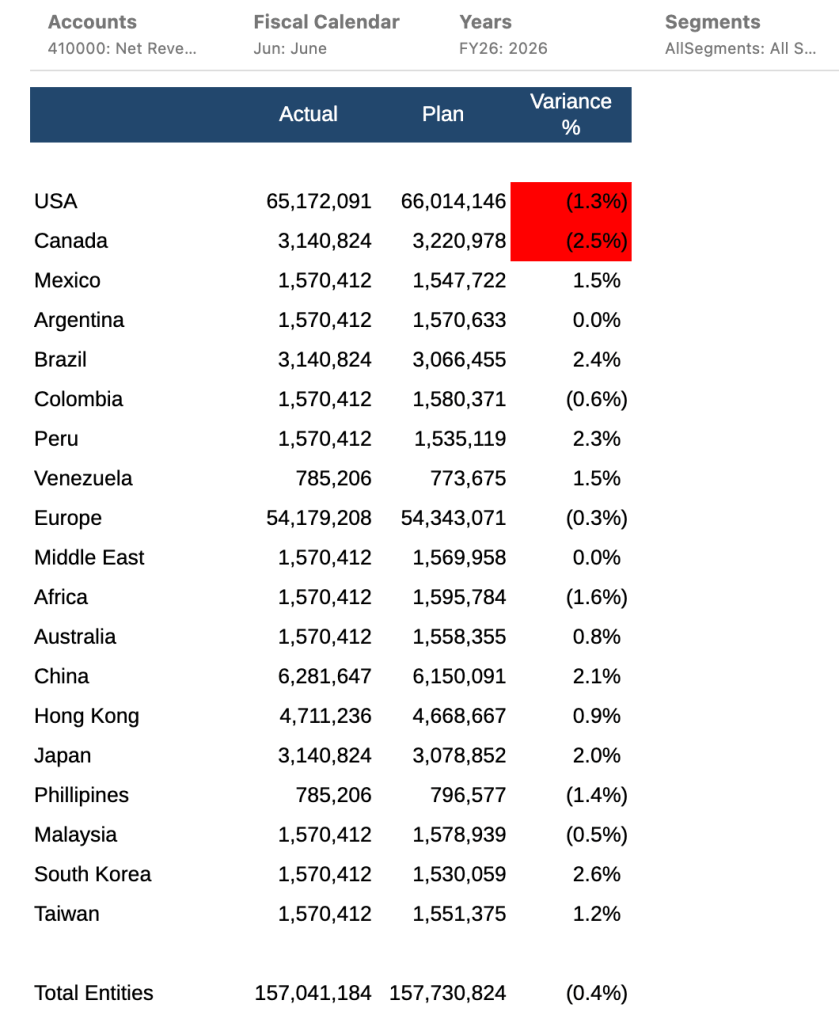
Yay! This is what I wanted. Now that I’ve isolated my new logic, tested it, and received a successful result, I’ll add back in the Yellow and Green conditional formatting (with some minor threshold adjustments), as well as the conditional suppressions.
My report looks great!
Enjoy!
